Overview Tab
Overview Tab
#38xxx
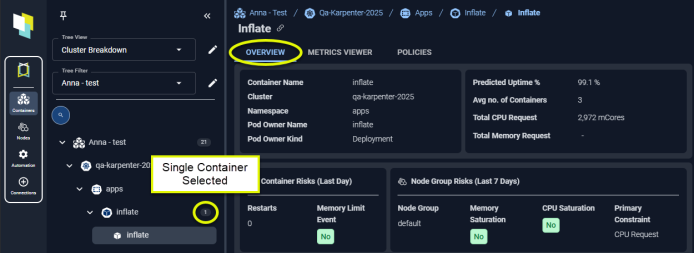
The cards on this tab provide a visual overview of a single container. When navigating the tree viewer, you will see this tab when a single item is selected.
You will see the Summary tab when more than one container is selected.
Figure: Locating the Overview Tab
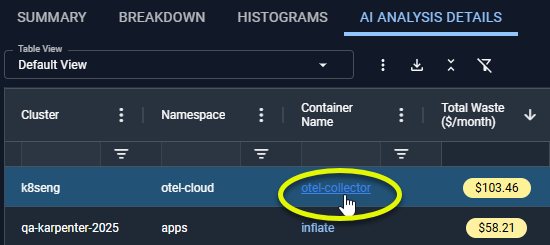
You will also see a modal view of this page when you click the hyperlink in the AI Analysis Details tab. This tab provides the container details in a format that is easier to view and to compare the current versus the recommended settings.
Figure: Accessing the Container Manifest Details
You also have access to the metrics viewer when a single container is selected.
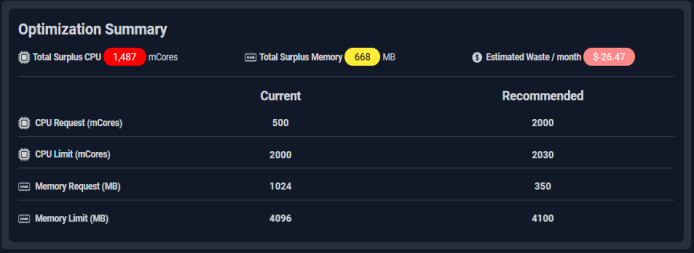
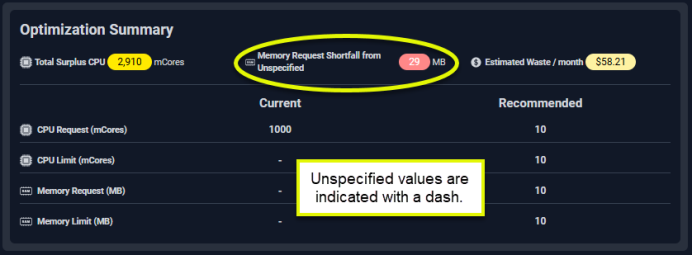
Optimization Summary
This card highlights your current settings and Densify's recommended settings, based on utilization.
Figure: Optimization Summary
Containers with Unspecified Settings
If the selected manifest does not have CPU or memory request values set, additional cards with details of the impact of unspecified values are shown. See Containers with Unspecified Settings for more details.
Figure: Optimization Summary - Unspecified Request Settings
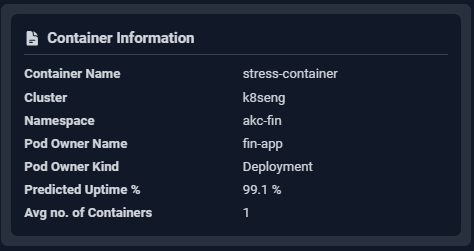
Container Information
Click any of the listed settings to see a brief description. Complete descriptions of each setting are provided in the AI Analysis Details Table.
Identifying details are displayed on this card.
|
Figure: Container Information
|
|
The cost per core and per GB of memory is configurable. Contact [email protected] for details.
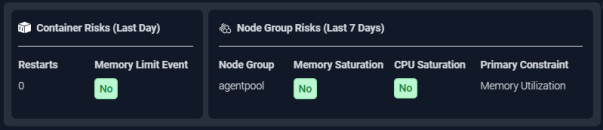
Risk Summary
These 2 cards summarize potential resource risks for the container and node group, on which the containers are running.
Figure: Risk Summary Details
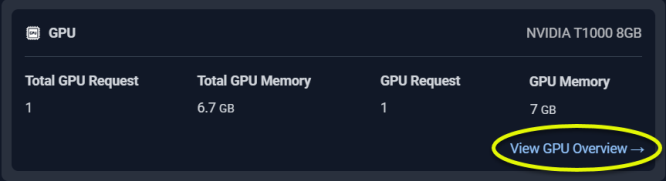
GPU Summary
This card summarizes the GPU allocation and for the selected container. This card is only displayed if the GPU resources have been allocated to this container. A hyperlink at the bottom of the card takes you to the GPU page.
Figure: GPU Summary
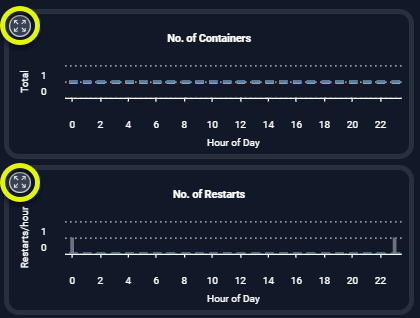
Utilization Charts
Utilization charts show hourly min/max and sustained activity for the selected system. The charts show the current and the recommended request and limit values for selected metrics. A chart is only displayed if the required data is available.
Details of working with there charts is provided in AI Analysis Details Utilization Charts.
|
Figure: Utilization Charts
|